Food Truck Menu Pricing: Formula, Food Cost % & Worked Examples
Quick answer
Price each food truck menu item with one formula: Menu Price = Total Cost per Serving ÷ Target Food Cost %. Aim for a 25–35% food cost, so a roughly $5 plate at 30% prices near $17. Dividing by the percentage bakes in labor, fuel, fees, and profit, keeping every item's margin consistent.
Pricing your food truck menu is the single most important financial decision you’ll make. Price too high and you scare customers away. Price too low and you work 12-hour days for no profit. This guide walks you through the exact formula food truck owners use to set prices that work — including how to price a food truck menu item by item, what food truck food cost percentage to target, and how to reprice for inflation without losing regulars.
Unlike a brick-and-mortar restaurant, a food truck carries hidden cost drivers that wreck naive pricing: generator fuel, commissary rent, parking and event fees, and the fact that you often sell most of your daily volume in a 2-3 hour rush. That means your menu pricing strategy has to bake in more than ingredients. By the end of this guide you’ll be able to set a defensible price for every item, know your target gross margin, and use a simple formula you can recompute any time a supplier raises a price.
The Food Truck Pricing Formula
Menu Price = (Ingredient Cost x Waste Factor + Packaging + Labor) / Target Food Cost %Let’s break that down with a real example. Say you’re pricing a chicken taco:
- Ingredients: $3.50 (chicken, tortillas, salsa, toppings)
- Waste factor: 5% => $3.68
- Packaging: $0.50
- Labor: $1.00
- Total cost per serving: $5.18
At a 30% target food cost: $5.18 / 0.30 = $17.27. Round to $17 or $18 for a clean menu price.
The reason you divide by the food cost percentage instead of just adding a markup is that the percentage already encodes every other cost and your profit. If you want food to be 30% of the menu price, the other 70% has to cover labor overhead, fuel, fees, and profit. Dividing the cost by 0.30 grosses the number up so that the price you land on makes your plate cost exactly 30% of revenue. This is the core menu pricing formula every operator should internalize:
Menu Price = Total Cost per Serving / Target Food Cost %If you prefer to skip the arithmetic, the menu pricing calculator does this instantly and lets you toggle the target percentage to see how the price moves.
Worked example: full menu priced from one formula
Here is the same formula applied across a small taco-truck menu. Notice how the price tracks the cost while the target food cost % stays roughly constant — that consistency is what protects your margin item by item.
| Menu Item | Ingredient + Waste | Packaging | Labor | Total Cost | Target FC% | Formula Price | Menu Price |
|---|---|---|---|---|---|---|---|
| Chicken taco | $3.68 | $0.50 | $1.00 | $5.18 | 30% | $17.27 | $17 |
| Carne asada burrito | $4.40 | $0.45 | $1.10 | $5.95 | 32% | $18.59 | $18 |
| Loaded nachos | $2.90 | $0.55 | $0.80 | $4.25 | 28% | $15.18 | $15 |
| Side of chips | $0.55 | $0.20 | $0.15 | $0.90 | 22% | $4.09 | $4 |
| Fountain drink | $0.35 | $0.18 | $0.10 | $0.63 | 18% | $3.50 | $3.50 |
Two things stand out. First, low-cost items like drinks and chips carry a deliberately lower food cost percentage — they’re your high-margin profit engine. Second, the rounded menu price is sometimes a touch below the formula price (the burrito formula said $18.59 but we charge $18); that’s a pricing decision to hit a clean number, and it’s fine as long as you make it back on the drink and side attached to that order.
What Food Cost Percentage Should You Use?
| Cuisine Type | Target Food Cost % | Gross Profit Margin |
|---|---|---|
| Coffee & Beverages | 15% – 20% | 80% – 85% |
| Ice Cream & Desserts | 15% – 25% | 75% – 85% |
| Tacos & Mexican | 25% – 30% | 70% – 75% |
| General Food Truck | 28% – 33% | 67% – 72% |
| BBQ & Meat Heavy | 35% – 40% | 60% – 65% |
The industry standard for food trucks is 30%. Coffee and ice cream operators enjoy much lower food costs (15-25%), while BBQ and meat-heavy concepts run higher (35-40%). For frozen dessert-specific examples, use the ice cream truck menu pricing guide.
The honest answer to “what food truck food cost percentage should I use” is: it depends on the item, not the truck. A blended target of 28-33% across your whole menu is the goal, but you hit that blend by mixing cheap, high-margin items (drinks, sides, chips) with pricier protein-heavy mains. If you try to force every single item to exactly 30%, your signature dish ends up overpriced and your drinks end up underpriced — you leave money on both ends. Aim for the blended average, not item-by-item uniformity.
A second nuance: your target food cost % should sit a few points below your break-even food cost %. If the point where you stop losing money is a 38% food cost, setting your target at 30% gives you an 8-point cushion for waste, theft, portion drift, and the inevitable day you sell out of cheap items first and finish the shift on your expensive ones. To find that break-even point for your specific overhead, run the numbers through the break-even calculator before you lock prices.
Portion control and waste — the silent margin killers
The formula assumes a fixed portion. In reality, a server who free-pours cheese or over-stuffs a burrito can quietly push a 30% food cost item to 40% without anyone noticing. Standardize portions with scoops, ladles, and pre-portioned proteins, and weigh a few plates during service to confirm staff are hitting spec. A 10% portion overage on your best-selling item can erase a full point of total margin across a month.
Waste belongs in the formula too. The 5% waste factor in the chicken-taco example reflects trim, spoilage, and comped or remade orders. Trucks running prep-heavy menus (anything with fresh herbs, avocado, or seafood) should budget 8-10%. Build the waste factor into ingredient cost before you divide by the target food cost % — adding it afterward understates your true plate cost.
Don’t forget packaging cost
Packaging is a real, per-order cost that brick-and-mortar restaurants barely think about but food trucks live and die by — every single sale leaves in a container. Clamshells, paper boats, napkins, cutlery, bags, drink cups and lids typically run $0.30-$0.80 per order, and eco-friendly compostable packaging can push that past $1.00. At 50 orders a day that’s $15-$50 in packaging daily, or $400-$1,300 a month. Always include packaging in the cost per serving line of the formula; leaving it out is one of the most common reasons a “profitable on paper” menu loses money in the till.
The Reverse Pricing Method
Here’s a technique most food truck owners don’t know: reverse pricing. Instead of starting with ingredients and calculating a price, start with your income goal and work backward.
Example: You want to earn $8,000/month. You plan to sell 50 orders/day, 26 days/month.
Required profit per order: $8,000 / 50 / 26 = $6.15
If your cost per serving is $5.18, your menu price needs to be: $5.18 + $6.15 = $11.33
At that price, your food cost % is: $5.18 / $11.33 = 45.7% — too high. You need either a higher price or lower costs.
This method forces you to be realistic about whether your business model actually works before you launch.
5 Menu Pricing Strategies
Cost-Plus Pricing
The standard formula above. Calculate your cost, add your target margin. Simple and reliable.
Competitive Pricing
Research what other food trucks in your area charge for similar items. Your prices should be within 10-15% of theirs unless you have a clear differentiator.
Value Menu Items
Add one or two lower-priced items ($5-$8) to attract price-sensitive customers. These build traffic; your higher-margin items drive profit.
Bundling, Combos, and Upsells
Offer combo deals (taco + drink + chips for $15 vs $18 separately). Bundles increase average ticket size and reduce perceived cost. The math works in your favor because the items you add to a combo — drinks and sides — are your lowest food cost % items, so a $3 “discount” on a combo might only cost you $0.80 in actual margin while raising the average order value by several dollars. Train staff on a single scripted upsell (“Want to make it a combo for $3 more?”) and you’ll lift average ticket 15-25% with zero extra marketing. Combos also speed up the line by collapsing three decisions into one, which is pure profit during a rush.
Psychological Pricing
$12.99 vs $13.00 matters. Use .99 endings for value perception and round numbers ($14, $18) for premium items. On a food truck where transactions happen fast and often in cash or contactless taps, charm pricing also speeds up the line — round-dollar and round-fifty prices ($8, $8.50, $12) make change and mental math instant, which matters when a 90-second-per-customer rush is the difference between serving the whole line and turning people away. Anchor your menu by listing your priciest item first or at the top; it makes everything below it feel reasonable by comparison.
Premium vs Value Positioning
Before you set a single price, decide which side of the street your truck is on. Value positioning wins on volume and speed: lower prices, simpler menu, faster line, food cost % can run a little higher because you make it up in turns. Premium positioning wins on margin: scratch-made, local-sourced, or chef-driven food at higher prices, a customer who expects to pay $16 for a sandwich, and a lower food cost % protected by perceived quality. The trap is the muddy middle — premium prices with value-grade ingredients (customers feel ripped off) or value prices with premium costs (you go broke). Pick a lane, then let it dictate your target food cost %, your packaging spend, and even your truck’s branding.
Repricing for inflation
Ingredient and packaging costs drift up constantly; prices set 18 months ago are almost certainly underwater today. The fix is not a once-a-year panic raise but small, regular adjustments. Recompute the formula whenever a key ingredient moves more than 10%, and prefer many small bumps ($0.50 here, $1 there) over one jarring increase — customers notice a $14 item jumping to $18 far more than they notice it creeping from $14 to $15 to $16 over a year. When you do raise prices, raise your highest-volume items last and least, and lead with the items where you have the most differentiation. Reformulating a combo or trimming a portion slightly are also valid responses to inflation that don’t require a visible price change.
Price vs margin scenarios
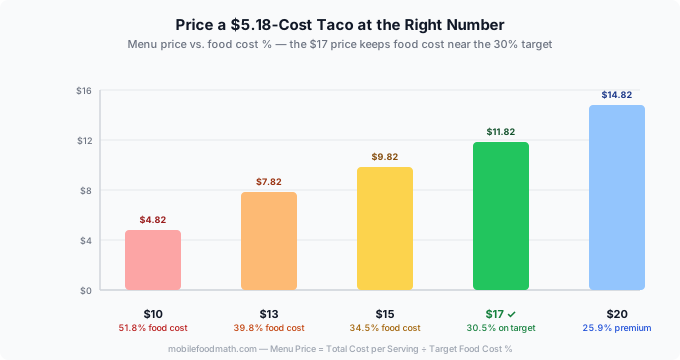
To make the cost-percentage relationship concrete, here’s the same $5.18-cost chicken taco priced five different ways. This is exactly the kind of what-if the menu pricing calculator lets you run live:
| Menu Price | Food Cost % | Gross Profit per Item | Verdict |
|---|---|---|---|
| $10 | 51.8% | $4.82 | Too cheap — barely covers overhead, no real profit |
| $13 | 39.8% | $7.82 | Below break-even cushion — risky |
| $15 | 34.5% | $9.82 | Workable for a value-positioned truck |
| $17 | 30.5% | $11.82 | On target — the recommended price |
| $20 | 25.9% | $14.82 | High margin — only if premium-positioned and demand supports it |
Notice the profit per item climbs steadily while the food cost % falls — but a higher price only works if customers actually buy at it. The right column is where pricing stops being math and becomes judgment about your customer and your competition. For the full picture of how these per-item margins roll up into take-home pay, see food truck profit and monthly profit.
Common Pricing Mistakes
- Forgetting to include labor in per-dish cost — labor is 25-35% of your total costs
- Not accounting for waste — 5-10% waste is normal for most food truck operations
- Setting prices once and never reviewing them — ingredient costs change, your prices should too
- Pricing everything the same — some items should be high-margin, others built to drive traffic
- Ignoring portion control — if staff are inconsistent with portions, your costs will drift
Try Our Free Menu Pricing Calculator
Enter your ingredients, set your target food cost %, and get the optimal price instantly. Includes reverse pricing and what-if scenarios.
Use the Menu Pricing CalculatorFrequently Asked Questions
How do I calculate food truck menu prices?
Calculate your total cost per serving (ingredients + packaging + labor), then divide by your target food cost percentage. Use our free calculator above to do this instantly.
What is a good food cost percentage for a food truck?
Most food trucks aim for 25-35% food cost. Coffee and beverages can go as low as 15-20%, while BBQ runs 35-40%.
Should I include labor in my menu pricing?
Yes. Your true cost per dish includes ingredients, packaging, and labor. Many operators forget labor and underprice.
What is the pricing formula for food trucks?
Menu Price = (Total Cost per Serving) / (Target Food Cost %). Total cost includes ingredients (with waste), packaging, and labor.
How often should I update my menu prices?
Review quarterly, or whenever an ingredient cost changes by more than 10%. Prefer frequent small adjustments over rare large ones — customers tolerate a $1 creep far better than a $4 jump, and regular reviews keep you ahead of inflation instead of scrambling to catch up.
How much do food trucks charge per item on average?
Most savory food truck mains land between $10 and $18, with sides at $3-$6 and drinks at $2-$4, though premium and big-city trucks routinely charge more. Your prices should reflect your local market and positioning rather than a national average — see how much do food trucks make for how per-item pricing translates into revenue.
Should every menu item have the same food cost percentage?
No. Aim for a blended 28-33% across the whole menu by pairing high-margin items (drinks, chips, sides at 15-22%) with protein-heavy mains that run 32-38%. Forcing uniformity overprices your signature dishes and underprices your easy money-makers.
Next Steps
- Startup Cost Calculator — See how your pricing affects your overall startup budget
- Profit Calculator — Project how menu pricing changes affect your bottom line
- Business Plan Guide — Include your menu pricing strategy in your financial projections
- Ice Cream Truck Menu Pricing — Price packaged bars, scoops, soft serve, and sundaes
Methodology & Assumptions
Cost ranges are planning models assembled from the line items and assumptions shown in this guide. They are not quotes or guaranteed market averages. This page identifies 2 cited sources; official fees and requirements should be checked against those links. AI tools may assist with organization and drafting, but they are not a source and no independent food-truck operator review is claimed. Local rules and prices can change; verify them before committing funds. Last updated: 2026-09-06.
Sources & verification
- USDA Economic Research Service — Food Price Outlook Official U.S. food-at-home and food-away-from-home price context.
- U.S. Small Business Administration — Break-even point Contribution-margin and break-even formulas used in pricing decisions.
Regulations and fees change. Confirm the current application, fee schedule, and operating rules with the issuing agency before purchasing a vehicle or signing a commissary agreement.