Food Truck Profit Margin: What's Healthy & How to Boost Yours
Quick answer
Use a 15–25% net-margin scenario as a planning target, not a national average. Model daily orders, average ticket, food cost, labor, service days, overhead, debt, and owner compensation to find your own break-even point.
There is no reliable public dataset that establishes one national food-truck profit average. A 15–25% net margin is useful as a planning target to stress-test, not a promised outcome. This guide walks through gross vs. net margin, cuisine scenarios, seasonality, owner compensation, and the math behind the levers that raise or lower margin.
Why Some Sources Say Food Truck Margins Are 6–9%
Industry roundups (including restaurant-POS and CFO reports) often put food-truck net margins at 6–9%. Those averages are real, but they are not a planning target for a lean, owner-run truck — they mix in part-time rigs, fully staffed multi-employee models, high food-cost concepts, and operators who count the owner’s labor inside the business. In that mix, “profit” is partly wages.
If you run the truck yourself with one or two part-time helpers, keep food cost under 30%, and work a high-traffic route, a 15–25% net margin is a defensible planning range — and the strongest operators push past it. The honest takeaway: don’t compare yourself to a category average. Model your own ticket, orders, and cost stack with the profit calculator, then test the result against your real first month.
Are Food Trucks Profitable? The Honest Answer
Profitability is not automatic, and public U.S. statistics do not isolate food-truck profit well enough to divide operators into reliable national tiers. The decision-grade test is local: compare contribution per order with fixed costs, then ask whether a tested route can support the required daily order count. Location, menu pricing, food cost, labor, debt, and owner compensation determine the result.
Food Truck Revenue Averages
Profit starts with revenue, and revenue is just daily orders multiplied by your average ticket, multiplied by how many days you actually operate. The table below shows the realistic spread. For a deeper revenue-side breakdown, see how much food trucks make.
| Metric | Low-volume scenario | Base scenario | High-volume scenario |
|---|---|---|---|
| Daily Orders | 20 | 50 | 80+ |
| Average Ticket | $10 | $14 | $18+ |
| Monthly Revenue | $5,200 | $18,200 | $37,440+ |
| Monthly Net Profit | $0-$2,000 | $5,000-$8,000 | $12,000+ |
| Net Profit Margin | 0-10% | 15-20% | 25-35% |
Notice that monthly revenue can vary 7x across the range while net profit varies far more — because the truck with $5,200 in revenue is still paying nearly the same fixed costs as the one doing $37,000. Fixed costs are the great equalizer: they punish low-volume trucks and reward high-volume ones.
Gross Margin vs. Net Margin (Don’t Confuse Them)
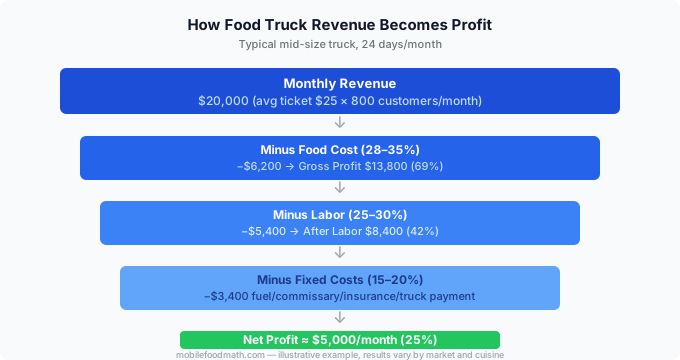
This is the single most common mistake new operators make. Gross margin is what’s left after food cost only. Net margin is what’s left after everything — food, labor, fuel, insurance, rent, permits, and fees.
- Gross margin = (Revenue − Food Cost) ÷ Revenue. With a 30% food cost, your gross margin is 70%. That number looks fantastic, and it’s the one truck owners love to quote.
- Net margin = (Revenue − All Costs) ÷ Revenue. After labor, overhead, and fees, that 70% gross typically collapses to a 15-25% net margin.
So a truck doing $18,000/month at a 70% gross margin keeps about $12,600 in gross profit — but after labor ($5,000), commissary and fuel ($1,000), insurance and permits ($600), and card fees, the net profit lands around $3,000-$5,000. When someone says food trucks have “70% margins,” they mean gross. The number that pays your mortgage is net.
Fixed vs. Variable Costs
Understanding which costs move with sales and which don’t is the key to predicting profit at any volume.
- Variable costs scale with each order: food cost (the big one) and payment-processing fees. Sell nothing, pay nothing.
- Fixed costs stay roughly the same whether you do 20 or 80 orders: labor (in practice, mostly fixed because you staff a full shift regardless), commissary rent, insurance, permits, loan payments, and generator fuel.
The table below breaks down a typical cost stack as a share of revenue.
| Expense | % of Revenue | Type | Detail |
|---|---|---|---|
| Food Cost | 30-35% | Variable | Your biggest lever. Keep it under 30% for healthy margins — see menu pricing. |
| Labor | 25-35% | Mostly fixed | $4K-$7K/month for 1-2 staff. Hardest cost to control once you’ve staffed the shift. |
| Commissary & Rent | 8-12% | Fixed | $300-$800/month for kitchen rental and parking. |
| Fuel & Generator | 5-8% | Mixed | $300-$800/month — varies hugely by territory size. |
| Insurance | 3-5% | Fixed | $200-$600/month for liability + vehicle coverage. |
| Permits & Licenses | 2-4% | Fixed | $200-$1,000/year depending on your city. |
| Card Processing | 2-3% | Variable | ~2.6% of card sales — easy to forget, hard to avoid. |
Together, food cost and labor account for 60-70% of total operating costs. If you can keep both under control, you’ll be in the top tier of profitable trucks. Because most of the rest is fixed, every extra order above break-even drops almost entirely to the bottom line.
A Full Revenue → Cost → Profit Walkthrough
Numbers in a vacuum are hard to trust, so here is the complete math for a worked scenario using 50 orders a day, 26 days a month, and a $14 ticket.
| Line Item | Calculation | Monthly Amount |
|---|---|---|
| Revenue | 50 × $14 × 26 | $18,200 |
| Food Cost (30%) | $18,200 × 0.30 | −$5,460 |
| Gross Profit | Revenue − Food | $12,740 |
| Labor | 1-2 staff | −$5,000 |
| Commissary & Rent | Fixed | −$600 |
| Fuel & Generator | Fixed | −$500 |
| Insurance | Fixed | −$400 |
| Permits (monthly share) | $1,000/yr ÷ 12 | −$83 |
| Card Processing | ~2.6% of sales | −$470 |
| Net Profit | Gross − all costs | $5,687 |
| Net Margin | $5,687 ÷ $18,200 | ~31% |
This particular setup lands at the high end because labor is lean and the ticket is solid. Push labor to $7,000 or drop the ticket to $11 and that same truck slides toward $3,000/month. You can run your own version of this in the profit calculator instead of doing the arithmetic by hand.
Food Truck Profit Margin by Cuisine
Not all menus carry the same margin. The driver is food cost percentage: cuisines built on cheap, shelf-stable staples (rice, beans, dough, tortillas) leave more room than those anchored on premium proteins or seafood. Here’s how common concepts typically stack up.
| Cuisine | Typical Food Cost | Net Margin | Why |
|---|---|---|---|
| Coffee & Drinks | 15-20% | 25-40% | Cheap inputs, premium pricing, fast tickets. |
| Pizza | 20-25% | 20-30% | Dough and cheese are inexpensive per slice. |
| Tacos / Mexican | 25-30% | 18-28% | Staple-heavy, scalable, low waste. |
| Burgers & Fries | 28-33% | 15-25% | Beef cost rises, but volume is high. |
| BBQ | 30-38% | 12-22% | Premium meat plus long cook times and shrinkage. |
| Seafood / Lobster | 35-45% | 8-18% | High-cost, perishable, price-volatile inputs. |
A coffee or dessert truck can post double the net margin of a lobster truck on the same revenue. That doesn’t make seafood a bad business — high tickets can offset thin margins — but it explains why concept choice is a profit decision, not just a branding one. For concept-specific deep dives, see the BBQ truck profit margin and taco truck profit margin breakdowns, or read how these numbers translate into food truck monthly profit by type.
Seasonality: Profit Isn’t Flat Across the Year
Monthly profit swings hard with the calendar in most U.S. markets. A truck that nets $8,000 in July may net $1,500 — or nothing — in January. Outdoor markets, festivals, and office-park lunch crowds dry up in cold or rainy months, and the fixed costs keep running whether or not you’re serving.
The operators who survive treat the busy season as the time to build a cash cushion for the slow months, and many go further: catering contracts, private events, indoor venues, and brewery partnerships smooth the curve. When you read an “average monthly profit” figure, remember it’s a blend of feast and famine, not a steady paycheck. The monthly profit guide digs into month-by-month planning.
Owner Salary vs. Business Profit
Here’s a distinction that trips up almost every first-year owner: the money the business earns is not the same as the money you take home. If you work the truck yourself, you should be paying yourself a wage for that labor — and that wage is a cost, not profit.
- If you pay yourself a market-rate cook/manager salary, your labor line already includes you. What’s left is true business profit (return on the capital and risk you put in).
- If you don’t pay yourself, your “profit” is really a blend of wages for your own work plus a thin business margin. It feels like a big number until you divide by the 60-hour weeks.
A truck “netting $6,000/month” where the owner works full-time is closer to a job paying ~$4,000/month plus ~$2,000 of business profit. That’s a perfectly fine outcome — but call it what it is. When you compare trucks or evaluate whether to buy one, separate the salary you’re earning from the return the asset is generating.
Break-Even Analysis: How Many Orders Per Day?
Before any profit appears, contribution margin must cover fixed costs. Here is the break-even math for one planning setup:
- Monthly fixed costs (labor + rent + insurance + permits): $7,000
- Average ticket: $14.00
- Food cost (30%): −$4.20
- Contribution per order: $9.80
- Orders needed/day (26 days): $7,000 ÷ 26 ÷ $9.80 = ~28 orders/day
That’s only about 3-4 orders per hour in an 8-hour shift. Most well-located trucks hit this by lunch alone, which is why location is so decisive — a bad corner can leave you a few orders short of break-even every single day. To pressure-test your own numbers, use the break-even calculator, and for a step-by-step walkthrough of the formula and how long recovery takes, see the food truck break-even analysis guide.
What Raises Your Margin: The Four Levers
Every profit improvement traces back to one of four levers. The What-If table shows how each one moves a baseline truck currently netting ~$2,740/month.
| Lever | Change | New Net Profit | Impact |
|---|---|---|---|
| Volume (location) | 50 → 80 orders/day | ~$10,384/mo | +279% |
| Pricing (ticket) | $14 → $18 ticket | ~$6,380/mo | +133% |
| Food cost % | 30% → 25% | ~$4,915/mo | +79% |
| Labor efficiency | Trim one shift | +$1,500-$3,000/mo | varies |
A few takeaways from the math:
- Volume wins biggest because your fixed costs don’t grow when you sell more — so a 60% jump in orders more than triples profit. This is why fighting for a high-traffic location beats almost anything else.
- Pricing is the fastest lever. A $4 ticket increase requires no extra cost; it flows almost entirely to net profit. Revisit pricing at least seasonally.
- Food cost discipline (portion control, supplier negotiation, waste tracking) is the slow-and-steady lever — every point off food cost is a point onto net margin.
- Labor efficiency is the trickiest. Over-staffing a slow shift quietly erases profit; right-sizing hours to demand recovers it.
Notice none of these require more revenue from the same customers being treated equally — they’re structural. Your startup costs also shape early margins, since loan payments are a fixed cost that competes with profit until paid off.
Monthly Profit Scenarios
To make the range concrete, here are three full-month scenarios for the same truck under different conditions.
| Scenario | Orders/Day | Ticket | Food Cost | Monthly Net Profit |
|---|---|---|---|---|
| Struggling (slow corner) | 25 | $11 | 35% | ~$300 |
| Base scenario | 50 | $14 | 30% | ~$5,700 |
| Thriving (prime spot) | 80 | $17 | 27% | ~$13,500 |
The struggling truck and the thriving truck might cost the same to operate and serve the same food — the difference is location, pricing, and a few points of food cost. That’s the whole game in one table.
Frequently asked questions
How much profit does a food truck make per month?
There is no dependable national monthly-profit average for food trucks. In the scenarios on this page, changing orders, ticket size, service days, and cost percentages produces results ranging from a loss to more than $10,000 in monthly profit. Use a rolling 12-month forecast because seasonality can make any single month misleading.
What is a good food truck profit margin?
A healthy net profit margin is 15-25%, and the strongest operators reach 25-35%. Gross margin (after food cost only) is much higher — typically 65-70% — but don’t confuse the two; the net margin after labor, overhead, and fees is the number that matters for your take-home.
Are food trucks profitable for beginners?
They can be, but profitability usually arrives after the first season once you’ve dialed in location, pricing, and food cost. Beginners who treat owner labor as free, under-price the menu, or pick a low-traffic spot are the ones who stall near break-even. Run your numbers in advance with a profit calculator before committing.
What is the biggest expense for a food truck?
Food cost (30-35% of revenue) and labor ($4K-$7K/month for two staff) are the two biggest, together accounting for 60-70% of operating costs. Controlling these two lines is the difference between a 12% and a 30% net margin.
How is food truck net profit calculated?
Net profit = revenue − food cost − labor − overhead (commissary, fuel, insurance, permits) − card-processing fees. Start with daily orders × average ticket × operating days for revenue, subtract every cost above, and what remains is net profit. Dividing that by revenue gives your net profit margin.
Methodology & Assumptions
Cost ranges are planning models assembled from the line items and assumptions shown in this guide. They are not quotes or guaranteed market averages. This page identifies 2 cited sources; official fees and requirements should be checked against those links. AI tools may assist with organization and drafting, but they are not a source and no independent food-truck operator review is claimed. Local rules and prices can change; verify them before committing funds. Last updated: 2026-08-26.
Sources & verification
- U.S. Small Business Administration — Break-even point Formula and inputs used for the guide's break-even examples.
- U.S. Bureau of Labor Statistics — Food service managers Independent labor-market context; food-truck owner earnings vary and are not a BLS category.
Regulations and fees change. Confirm the current application, fee schedule, and operating rules with the issuing agency before purchasing a vehicle or signing a commissary agreement.